Prometheus 监控SpringCloud微服务
介绍
Prometheus 监控应用的方式非常简单,只需要进程暴露了一个用于获取当前监控样本数据的 HTTP 访问地址。这样的一个程序称为Exporter,Exporter 的实例称为一个 Target 。Prometheus 通过轮训的方式定时从这些 Target 中获取监控数据样本,对于应用来讲,只需要暴露一个包含监控数据的 HTTP 访问地址即可,当然提供的数据需要满足一定的格式,这个格式就是 Metrics 格式.
SpringBoot 2.x上已引入第三方实现的metrics Facade,默认与Micrometer集成,而Micrometer具有Prometheus的MeterRegistry规范的实现。Spring Boot 应用和Prometheus 集成,需要增加micrometer-registry-prometheus依赖,同时依赖于springBoot的监控状态监控actuator。
SpringBoot配置
  org.springframework.boot
  spring-boot-starter-actuator


    io.micrometer
    micrometer-registry-prometheus
配置文件
management.endpoint.metrics.enabled=true
management.endpoints.web.exposure.include=*
management.endpoint.prometheus.enabled=true
management.metrics.export.prometheus.enabled=true
添加上述依赖项之后,Spring Boot 将会自动配置 PrometheusMeterRegistry 和 CollectorRegistry来以Prometheus 可以抓取的格式(即上文提到的 Metrics 格式)收集和导出指标数据。
所有的相关数据,都会在Actuator 的 /prometheus端点暴露出来。Prometheus 可以抓取该端点以定期获取度量标准数据。
Prometheus 修改配置文件
增加job paw-service机器 localhost:8080标签 监控的服务 paw-kelk
# my global config
global:
  scrape_interval:     15s # Set the scrape interval to every 15 seconds. Default is every 1 minute.
  evaluation_interval: 15s # Evaluate rules every 15 seconds. The default is every 1 minute.
  # scrape_timeout is set to the global default (10s).

# Alertmanager configuration
alerting:
  alertmanagers:
  - static_configs:
    - targets:
      # - alertmanager:9093

# Load rules once and periodically evaluate them according to the global 'evaluation_interval'.
rule_files:
  # - "first_rules.yml"
  # - "second_rules.yml"

# A scrape configuration containing exactly one endpoint to scrape:
# Here it's Prometheus itself.
scrape_configs:
  # The job name is added as a label `job=` to any timeseries scraped from this config.
  - job_name: 'prometheus'

    # metrics_path defaults to '/metrics'
    # scheme defaults to 'http'.

    static_configs:
    - targets: ['localhost:9090']
  - job_name: paw-service
    metrics_path: /actuator/prometheus
    static_configs:
    - targets: ['localhost:8080']
      labels:
        applicaton: paw-kelk
        env: dev
启动prometheus服务
./prometheus --config.file=prometheus.yml
输入 http_server_requests_seconds_count 显示图形界面
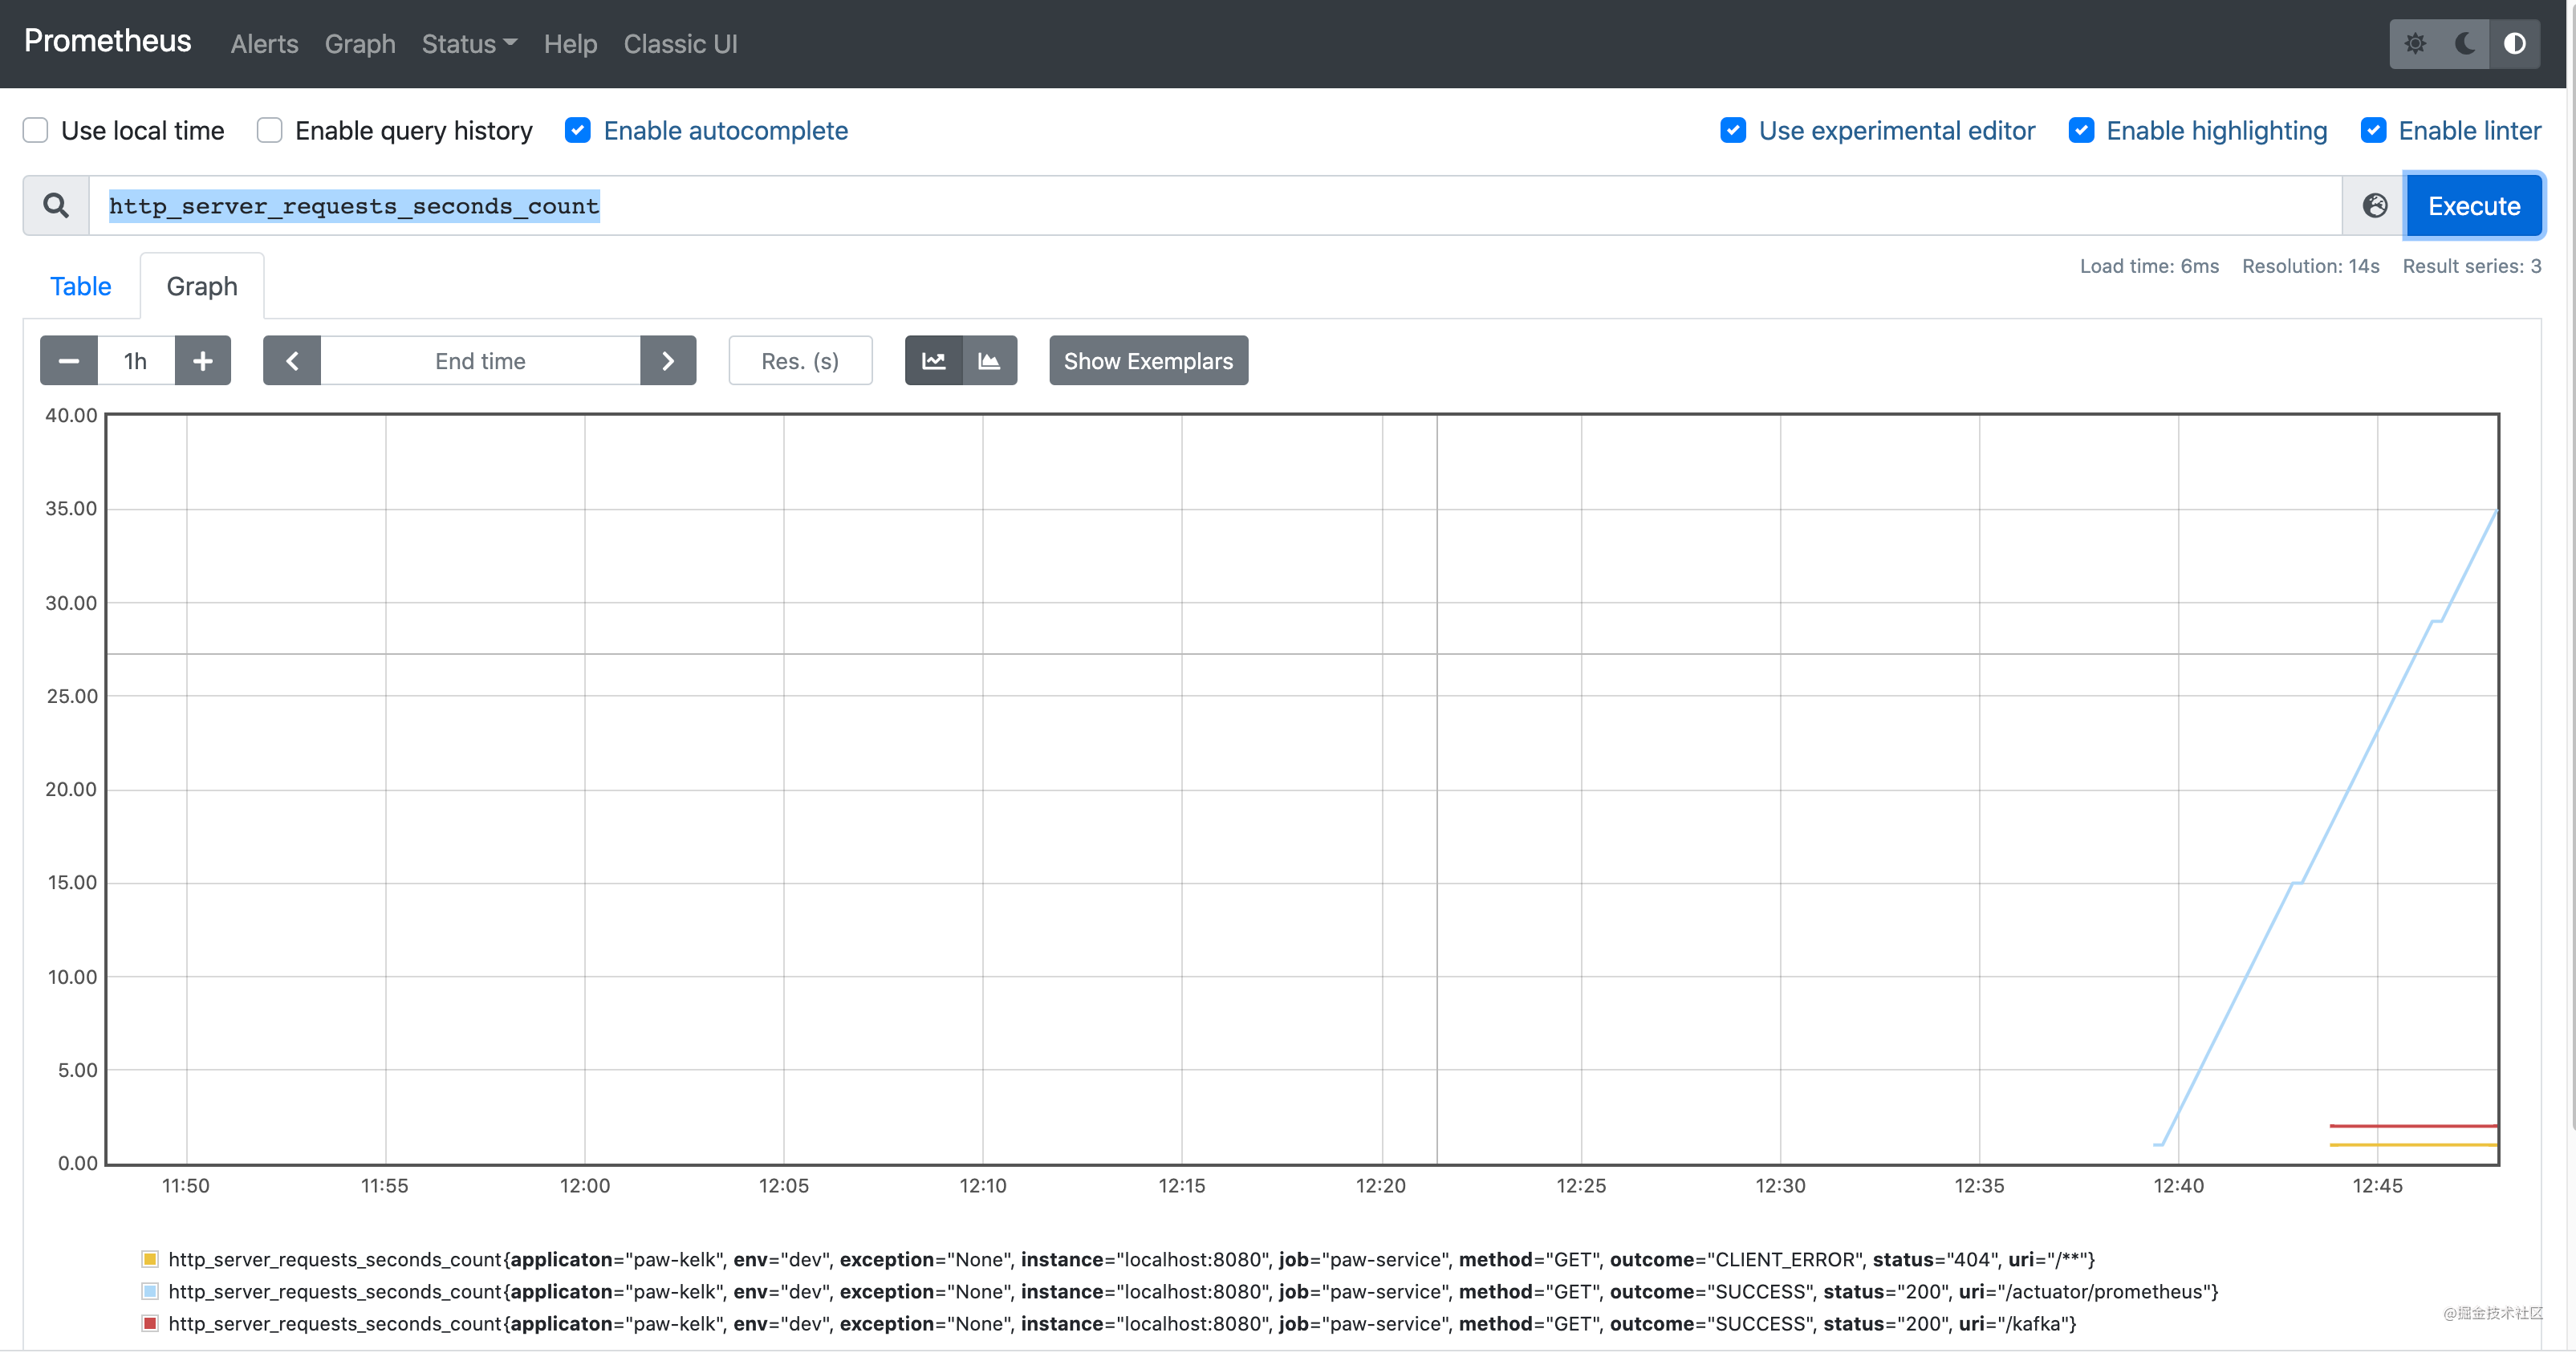
监控了微服务请求http 的状态,jvm的状态,还可以自己做埋点进行监控。